Origins of Color in Brown Mammoth Ivory

ABSTRACT
Mammoth ivory is a notable organic gem material, most commonly found with a brown surface color. To investigate the origins of this color, Fourier-transform infrared spectroscopy, X-ray diffraction, and scanning electron microscopy with energy-dispersive X-ray spectroscopy were used to study the samples’ spectroscopic and mineralogical characteristics, surface morphology, and chemical composition. Brown mammoth ivory is composed mainly of hydroxyapatite, carbonate hydroxyapatite, and collagen. With the dissolution and loss of organic matter and phosphate anions, fissures and cracks formed. Subsequently, hematite, pyrite, pyrolusite, and manganite crystallized on the mammoth ivory’s surface and concentrated in the cracks of the cementum layer. The phase transformation processes during the burial time promoted the formation of iron oxides, manganese oxides, manganese hydroxides, and iron sulfides, which resulted in the brown surface color.
The mammoth species were once the largest terrestrial mammals in the world during the Late Pleistocene (approximately 350,000 to 10,000 years ago), inhabiting the northern hemisphere, starting in Europe and extending as far east as North America (Zhou, 1978; Lister and Sher, 2001; Nogués-Bravo et al., 2008). Mammoths disappeared toward the end of the Late Glacial period (approximately 15,000 or 14,000 to 10,000 years ago). Their ivory has typically been extracted from natural permafrost deposits near rivers, lakes, or basins (Saunders et al., 1990; Cieszkowski et al., 2010).
Mammoth ivory can provide biological information for the Pleistocene period, and paleontologists usually study mammoth tusks as fossils. These fossils yield insights into the genus classification, distribution, migration, and evolution of mammoth, mainly on the Eurasian and North American continents, providing more information about the paleoenvironment and climate change during the Pleistocene (Saunders et al., 1990; Cieszkowski et al., 2010; Han et al., 2013; Wooller et al., 2021).
Mammoth ivory has a long history of use in jewelry and artwork (e.g., figure 1) because of its beauty and pleasing texture (Saunders et al., 1990; Lázničková-Galetová, 2015; Pitulko et al., 2015). The Schreger lines in mammoth ivory increase its elasticity; this can be reflected by a corrugated texture in the cementum and a reduction in mechanical damage. High-quality mammoth ivory has a fine, smooth texture and high tensile strength, and it has a unique luster and feel when carved into ornamental objects or jewelry (Pitulko et al., 2015). Similar to elephant ivory, it exhibits fascinating colors and patterns and can take on a smoother polish than other organic raw materials (Pfeifer et al., 2019). Due to various international bans on the sale of elephant ivory, mammoth ivory has gradually replaced it as an organic gem (Martin, 2006; Qi et al., 2010; Yin et al., 2013).
To date, gemological studies of mammoth ivory have focused mainly on the material’s composition, the crystallographic characteristics of inorganic minerals within, and the means of separating it from elephant ivory (Qi et al., 2010; Wu et al., 2013; Ngatia et al., 2019; Sun et al., 2022). Hydroxyapatite, Ca10(PO4)6(OH)2, is considered the main mineral component in mammoth ivory (Sakae et al., 2005; Shen et al., 2021; Sun et al., 2022). Newberyite (Mg(PO3OH)•3H2O), organic matter, quartz (SiO2), and vivianite (Fe2+3(PO4)2•8H2O) along with its oxidation products—e.g., metavivianite (Fe2+Fe3+2(PO4)2(OH)2•4H2O) and santabarbaraite (Fe3+3(PO4)2(OH)3•5H2O)—have been found to exist in all structures of mammoth ivory (Shen et al., 2021). Research suggests that elephant ivory and mammoth ivory can be distinguished by the angles formed by their characteristic Schreger lines (Espinoza and Mann, 1993; Singh et al., 2006; Palombo et al., 2012). In mammoth ivory, this angle is generally less than the angle in elephant ivory (Qi et al., 2010).
The surface of mammoth ivory usually has a brown color but is occasionally blue to dark blue or even black. Research on the origins of this surface color is scarce, however. A blue encrustation on some previously studied samples was identified as vivianite (McClure, 2001).
In this paper, Fourier-transform infrared spectroscopy (FTIR), X-ray diffraction (XRD), and scanning electron microscopy (SEM) with energy-dispersive X-ray spectroscopy (EDS) were used to study the mineral and chemical compositions and the surface morphology characteristics of brown mammoth ivory to illustrate the origins of this color.
MATERIALS AND METHODS
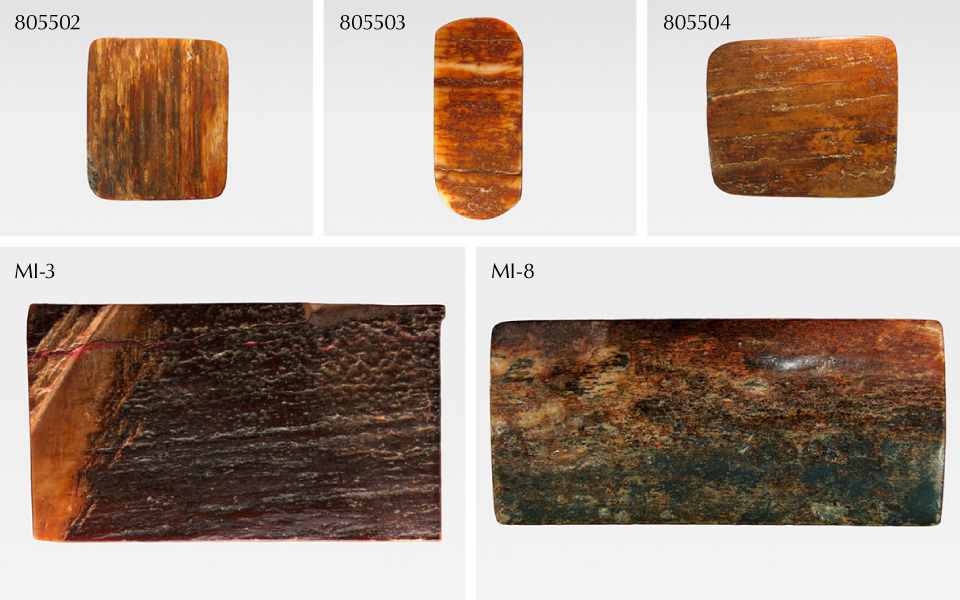
Five mammoth ivory samples were chosen for this research (figure 2). Samples 805502, 805503, and 805504 (top row) were provided by the Gemmological Institute, China University of Geosciences in Wuhan. Samples MI-3 and MI-8 (bottom row) were collected from the Liwan Plaza jewelry market in Guangzhou. None of the samples included information about their original source. The five samples ranged from 2.8 × 2.5 × 0.6 cm to 6.5 × 3.0 × 1.0 cm and weighed 4.16–37.48 g. Each had a brown to dark brown surface, with sample MI-8 also displaying a blue-black area on the surface.
All samples were tested at the Gemmological Institute and the State Key Laboratory of Geological Process and Mineral Resources, both at the China University of Geosciences in Wuhan. The color distribution, surface fissures, and cementum layers were observed and photographed using a Leica M205A microscope camera. Ultraviolet fluorescence was observed using a Baoguang Instruments UV5000XL long-wave (365 nm) and short-wave (254 nm) UV light.
FTIR spectra were obtained with a Bruker Vertex 80 Fourier-transform infrared spectrometer. The surface, cementum, and dentine layers were each tested using the following conditions: 220 V scanning voltage, 6 mm raster, 10 kHz scanning rate, 32 scans in the range of 4000–400 cm–1, and a resolution of 4 cm–1, with reflection modes from the Kramers-Kronig transform method applied.
XRD patterns were collected by an X'Pert Pro X-ray diffractometer. The brown surface and cementum layer of the samples were pulverized to 200 mesh powder for testing. The system was equipped with a conventional copper source (λ=1.5406 Å) at 40 kV and 40 mA, with a scanning speed of 3.35°/min in the 2θ range 3°–70° and a step size of 0.0167°/s.
Surface morphology characteristics were acquired using a Quanta 450 FEG scanning electron microscope and a Thermo Fisher Helios G4 double-beam electron microscope at an accelerating voltage of 20 kV. Both SEM instruments were equipped with an energy-dispersive X-ray spectroscope, operating at a voltage of 20 kV to collect chemical composition information. Chemical compositions were analyzed using OxfordAztec 5.0 and calibrated using wollastonite (Ca), gallium phosphide (P), iron (Fe), manganese (Mn), ferrous disulfide (S), aluminum oxide (Al), silicon dioxide (Si), magnesium oxide (Mg), and potassium bromide (K). Because mammoth ivory has abundant cracks, fissures, and pores, the samples needed to be pretreated with resin to ensure that the SEM experiments could be performed under a vacuum environment. A carbon film (approximately 10–20 nm) was deposited on the surface by sputtering to make the samples conductive. Backscattered electron (BSE) mode was used to collect images.
RESULTS
Microscopic Observation. The gemological characteristics of the five samples are presented in table 1. Each sample showed the characteristic structure of mammoth ivory on the surface and in cross section. The color distribution on the surface was not uniform, displaying tan and dark brown colors with irregular tan dots and cracks distributed randomly (figure 3). Some large cracks were parallel to each other (figure 3, A and C). The cracks showed a darker brown color than the other areas (figure 3D), and the surface exhibited a waxy luster in reflected light.


Cross-section images of the cementum are shown in figure 4. The cementum is a thick layer (approximately 4–7 mm) on the outside of the tusk. Its structure differs from the interior, which contains no Schreger lines but does have a layered structure running parallel to the length of the tusk (figure 4A). The cementum in mammoth ivory samples is much thicker than that of modern, unfossilized Asian and African ivory (Yin et al., 2013). Compared to the surface, the cementum layer has fewer cracks. The brown color entered the samples’ cementum along the cracks from the surface (figure 4, A–C). From the surface to the cementum, the color becomes gradually lighter (figure 4B). In the dentine layer, the angle of the Schreger lines ranged from 95° to 105° (except for sample 805503, which showed no obvious Schreger lines). This angle was lower than the mean value for Asian and African ivory, which is above 105° (Espinoza and Mann, 1993; Singh et al., 2006).
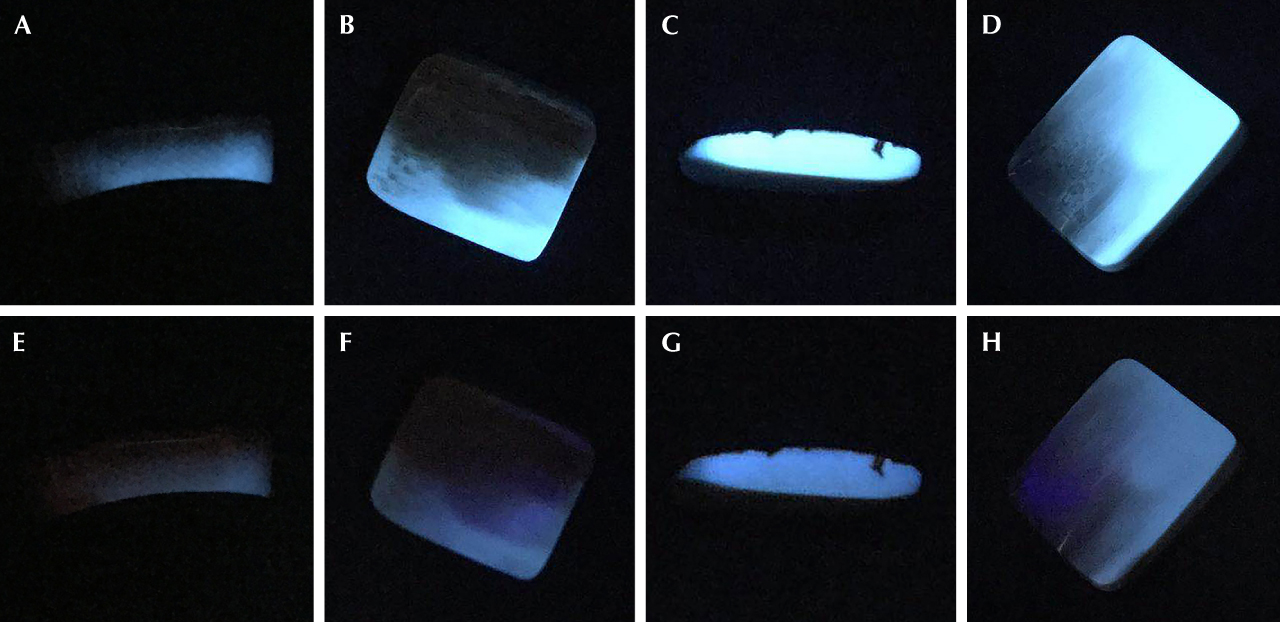
UV Fluorescence Characteristics. The mammoth ivory samples exhibited blue fluorescence under UV light (figure 5). The fluorescence intensity under long-wave UV (figure 5, A–D) was stronger than under short-wave UV (figure 5, E–H). The blue fluorescence is caused mainly by organic matter, so it is stronger in the dentine. The surface and some dentine areas that underwent fossilization showed no fluorescence reaction (figure 5, B–D and F–H), indicating that the composition of the mammoth ivory had changed and some organic matter might have been lost.

Infrared Spectra Characteristics. The infrared spectra of the surface, cementum, and dentine layers are shown in figure 6. The spectral peaks at 2926 and 2856 cm–1 were related to collagen (Yin et al., 2013; Xu and He, 2015). In the three peaks known collectively as the collagen amide bond, these vibrations include a peak at 1653 cm–1 associated with C=O bond stretching, a peak at 1557 cm–1 associated with both an N-H bending vibration and a C-H stretching vibration, and the peak at 1241 cm–1 associated with an N-H bending vibration and a C-N stretching vibration. An additional peak at 1457 cm–1 was due to a C-H bending vibration. These four peaks in the range of 1600–1200 cm–1 were also related to the presence of collagen (Huang et al., 2004; Qi et al., 2010; Wu et al., 2013; Shen et al., 2021). The peaks at 1418 and 874 cm–1 were caused by a carbonate anion (CO32–) group vibration, indicating that CO32– replaced the phosphate anion (PO43–) group in mammoth ivory. The peaks at 1054, 608, and 575 cm–1 were associated with PO43– group vibration (Zhou et al., 1999; Shen et al., 2021; Sun et al., 2022). Therefore, the mammoth ivory samples were found to be composed of inorganic matrix and organic protein.
Comparing the infrared spectra of the surface and the dentine of the mammoth ivory samples, the absorption peak positions were similar but the relative intensities were different for four of the samples. The exception was sample 805503, which is not severely fossilized and whose surface is not completely discolored, so the differences in the infrared spectra of the surface, cementum, and dentine are not obvious. For samples 805502, 805504, MI-3, and MI-8, the relative intensities of the collagen bands decreased, while the intensity of the PO43– group vibration was unchanged. For example, the intensity ratio of the absorption peak at 1653 cm–1 and the absorption peak at 1054 cm–1 decayed from nearly one-half to less than one-third from dentine to surface. Also, the peaks at 1557 and 1241 cm–1 are almost too weak to be observed in the surface’s infrared spectra. This indicates that organic protein components of mammoth ivory decreased from the inner dentine layer toward the surface. Elephant ivory, on the other hand, shows almost no change in organic protein content between the two layers (Qi et al., 2010; Yin et al., 2013).

X-Ray Diffraction. The powder XRD patterns for the different layers of samples MI-3 and MI-8 are shown in figure 7. Most of the peaks—including the three strongest peaks at d002 = 3.44 Å (2θ = 25.82°), d211 = 2.81 Å (2θ = 32.00°), and d222 = 1.94 Å (2θ = 46.84°)—belonged to hydroxyapatite, Ca10(PO4)6(OH)2; see International Centre for Diffraction Data Powder Diffraction File (ICDD PDF01-1008; Wang et al., 2012). This indicates that hydroxyapatite is the dominant phase in mammoth ivory. Hydroxyapatite is generally amorphous in elephant ivory and was considered to be amorphous in mammoth ivory as well (Sakae et al., 2005; Shen et al., 2021; Sun et al., 2022). But after it has undergone burial and weathering, hydroxyapatite in mammoth ivory is considered to be petrified, and its crystallinity can increase (Yin et al., 2013; Xu and He, 2015). The crystallinity of hydroxyapatite can be calculated by the full width at half maximum (FWHM) of the (002) peak using XrayRun software with Gaussian peak profile fitting, where a larger FWHM value indicates a lower crystallinity (Sun et al., 2022). The mean FWHM value of the (002) peak on the surface was 0.397° (standard deviation 0.034°), compared to 0.596° (standard deviation 0.017°) for the dentine. Therefore, the crystallinity of hydroxyapatite was higher on the surface.

Some weak peaks in the XRD patterns, especially from the surface, did not belong to hydroxyapatite (table 2), indicating other phases existed in the samples. The peaks at d012 = 3.70 Å (2θ = 24.04°), d104 = 2.71 Å (2θ = 32.99°), and d110 = 2.52 Å (2θ = 35.60°) were attributed to hematite (Fe2O3, ICDD PDF72-0469; Malik et al., 2014). The peak at d210 = 3.35 Å (2θ = 26.58°) was attributed to the strongest peak of manganite (MnO(OH), ICDD PDF74-1631; López et al., 2002), the peak at d110 = 3.13 Å (2θ = 28.48°) was attributed to the strongest peak of pyrolusite (MnO2, ICDD PDF72-1984; Costa et al., 2019), and the peak at d112 = 2.78 Å (2θ = 32.14°) was attributed to the strongest peak of carbonate hydroxyapatite (ICDD PDF19-0272; Wei et al., 2003). This indicates that minor hematite, manganite, pyrolusite, and carbonate hydroxyapatite existed in mammoth ivory. Furthermore, the peak at 2θ = 32.8°–33.0° in the surface was broad and asymmetrical, demonstrating that more than one diffraction peak merged in this area. The peak at 32.81° may be attributed to pyrite (FeS2), whose strongest peak is at d200 = 2.71 Å (ICDD PDF71-2219; Horng and Roberts, 2018). Further evidence such as SEM-EDS is needed to prove the existence of hematite, pyrite, manganite, and pyrolusite on the surface.


Morphology Characteristics. Figures 8 and 9 show the BSE images of the surface and a cross section of the cementum layer of samples MI-3 and MI-8. The contrast of the BSE image is related to chemical composition. The elements with a higher atomic number appear brighter. In figure 8, irregular particles with different size and contrast are distributed on the surface, indicating that elements with a higher atomic number than that of calcium coexisted with matrix hydroxyapatite (figure 8, A and B). In addition, some of the cracks observed on the surface were filled with brighter microparticles (figure 8C). The dark diagonal lines are residual polish marks (figure 8, C and D).
In figure 9, an abundance of cracks can be seen in the cementum layer. The larger cracks were stretching into the piece from the surface, and the direction of stretching is perpendicular to the surface (figure 9, left). The tiny fissures were distributed randomly, some of them parallel to the surface (figure 9, right). Brighter microparticles were also observed in the cementum in the mammoth ivory samples (figure 9, left). The quantity of these particles decreased from the surface to the interior.


Chemical Composition. The surface chemical composition of samples MI-3 and MI-8 was tested by EDS. The EDS data revealed that the matrix hydroxyapatite contained calcium, phosphorus, and oxygen, while the brighter microparticles were composed of iron, manganese, oxygen, and sulfur (table 3). Element mapping was used to explore the element distribution. As shown in figure 10 (C and D) and figure 11 (C and D), calcium and phosphorus were the main elements on the surface and correspond to hydroxyapatite. The brighter-contrast areas (particles) were the same areas that had no calcium and phosphorus but instead contained iron, manganese, oxygen, and sulfur (E–H in figures 10 and 11). As shown in the element maps, particles of manganese oxide and manganese hydroxide were concentrated in the cracks while iron oxide and iron sulfide particles were distributed evenly on the mammoth ivory’s surface, some of them concentrated on the fissures. The iron sulfide particles (or their aggregations) were larger than the iron oxide particles. Combining these findings with XRD results, it can be determined that these iron- and/or manganese-rich minerals are hematite (Fe2O3), pyrite (FeS2), pyrolusite (MnO2), and manganite (MnO(OH)).
DISCUSSION
Testing showed that the mammoth ivory samples were composed mainly of hydroxyapatite, carbonate hydroxyapatite, and collagen. Hydroxyapatite was characterized by carbonate anions replacing phosphate anions during recrystallization. After burial, the mammoth ivory began to lose its organic matter and phosphate anions due to fossilization. At the same time, the mammoth ivory gradually formed fissures and cracks, which increased the dissolution and the loss of organic matter and phosphate anions. An abundance of irregular iron or manganese oxide particles (hematite and pyrolusite), manganese hydroxide particles (manganite), and iron sulfide particles (pyrite) were found distributed on the surface, even penetrating the cementum layer.
The fossilization processes led to changes in the mammoth ivory composition. The loss of collagen caused the inorganic components to become more susceptible to erosion by other substances in the external aquatic environment (Edwards et al., 2005; Heckel et al., 2014). Manganese oxides, which are very common in the geochemical environment, were able to form on the substrate of mammoth ivory during fossilization (Reiche and Chalmin, 2008). Some reddish brown deposits in fossil ivories have already been proved to be iron oxides (hematite) or a mixture of iron and manganese oxides (Reiche and Chalmin, 2008; Reiche et al., 2013).
On the other hand, phosphate anions (PO43–) interact strongly with iron oxides. Phosphate anions can act as a template for hematite formation at all temperatures for most of the pH and phosphorus/iron ratio ranges (Gálvez et al., 1999; Kim et al., 2022). The newly formed microminerals on the mammoth ivory’s surface are composed of iron and phosphate minerals, such as vivianite, that are usually unstable and easily transit to more stable phases (McConnell, 1979; Shen et al., 2021). The phase transformation resulted in tiny spherical hematite nanoparticles approximately 5 nm in size (Gálvez et al., 1999; Kim et al., 2022). The iron phosphate mineral (vivianite) detected on one blue-black encrustation was thought to be the result of a chemical reaction of phosphate in mammoth ivory over a long period of time (McClure, 2001).
The fossilization of tusks may involve organic reactions. Bacteria have been detected previously in mammoth ivory (Edwards et al., 2005). Both iron and manganese have chemical properties that tend to form complexes with various inorganic or organic compounds and undergo reactions such as adsorption or ion exchange on solid surfaces (Nealson, 1983). The life activities of microorganisms and changes in the environment, such as changes in temperature, humidity, and pH value, could affect the process of biomineralization (McConnell, 1979). These conditions can lead to changes in the ion valence of iron and manganese and the formation of oxides, hydroxides, or sulfides on the surface of mammoth ivory.
As a result, the dissolution and loss of organic matter and phosphate anion from buried mammoth ivory provide more opportunities for the crystallization of iron oxides, manganese oxides, manganese hydroxides, and iron sulfides on the surface of the material. A combination of microscopic observation and comprehensive phase studies (FTIR, XRD, and SEM with EDS) revealed that on the surface of mammoth ivory, pyrite is usually yellowish brown, hematite is mostly red or dark gray, and pyrolusite and manganite are generally black. These microminerals cause the brown surface color.
CONCLUSIONS
The main components of the mammoth ivory samples from this study were hydroxyapatite, carbonate hydroxyapatite, and collagen, identified by FTIR, XRD, and EDS. From the inner dentine out toward the cementum layer, organic protein components decreased and the crystallinity of hydroxyapatite increased. During burial time, fissures and cracks formed on the surface and cementum layer, and iron oxides (hematite), manganese oxides and hydroxides (pyrolusite and manganite), and iron sulfide (pyrite) crystallized on the surface. These compounds were identified by XRD, SEM, and EDS. Through complex processes, fossilized mammoth ivory was covered with iron oxides, manganese oxides, manganese hydroxides, and iron sulfide, which produced its brown surface color.