Color Modification of Spinel by Nickel Diffusion: A New Treatment
ABSTRACT
A set of faceted spinel with blue to green hues, marked as “cobalt diffused,” was obtained by researchers from GIA in Bangkok. Analyses of the absorption, luminescence, and chemistry of the stones have revealed that they were not diffused with cobalt, but instead with nickel. Laser ablation–inductively coupled plasma–mass spectrometry indicated high nickel concentrations (tens of thousands of ppma) at the edge of the stones, and a compositional traverse across one spinel showed a decrease of nickel toward the core, consistent with diffusion treatment. The trace element concentrations in the cores were consistent with natural spinel, as were the refractive indices. A similar decrease in lithium concentration was also seen, suggesting that treatment was done in the presence of a flux melt. Absorption spectra recorded in the ultraviolet/visible/near-infrared region contained characteristic bands at 369, 381, 475, 597, and 639 nm. Annealing experiments conducted on one spinel demonstrated that the 475 nm band is sensitive to the oxygen partial pressure (pO2) in the experiment. The band increases in intensity following a high-pO2 anneal, then decreases following an anneal at low pO2. Photoluminescence spectra were consistent with heated natural spinel. This treatment now exists in the gem market and should be considered a possibility in spinel with blue or green hues.

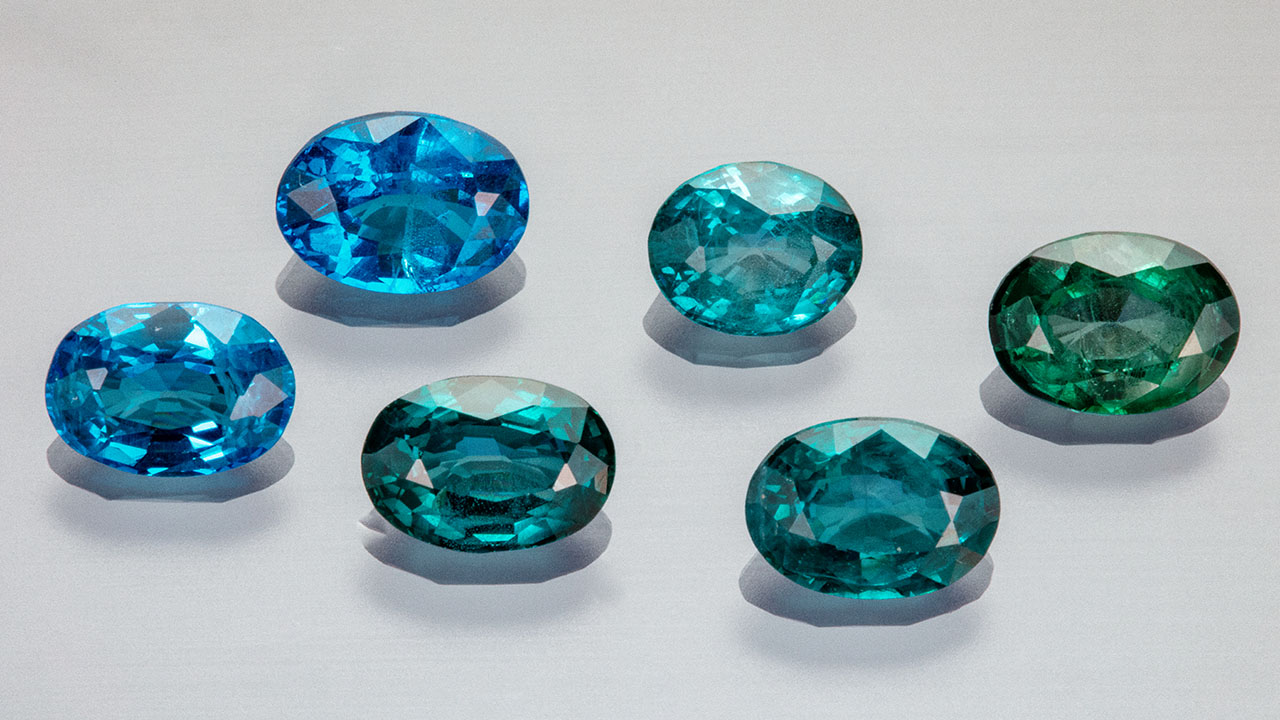
In November 2022, a parcel of 24 spinels weighing approximately 0.51–1.19 ct and described as “cobalt diffused” was obtained by the research team at GIA in Bangkok. Of these, eight possessed the deep blue color characteristic of cobalt diffusion, while the others had lighter blue, greenish blue, bluish green, or blue-green color (figure 1). Wafers were cut from the core of several stones, and all showed diffuse color zonation, from more blue/green at the rim to near-colorless at the core (figure 2).
The concentrations of various elements were recorded along culet-to-table transects in the wafers using laser ablation–inductively coupled plasma–mass spectrometry (LA-ICP-MS). The expectation was that all stones would show simple cobalt diffusion profiles, meaning high cobalt concentrations at the edge, changing gradually to lower concentrations in the core. This has been well described by Saeseaw et al. (2015), Peretti et al. (2015), and Krzemnicki et al. (2017). For the deep blue stones, the result was as expected: high cobalt, thousands of atomic parts per million (ppma) at the rim, changing gradually to low cobalt in the core. This is clear evidence of cobalt diffusion treatment. However, all other stones (i.e., those that were not deep blue) showed something quite different. The cobalt concentration in these crystals was negligible, generally below a few atomic ppm. The nickel concentration, conversely, was extremely elevated, generally around 10000 to 20000 ppma at the rim and dropping to a few ppma in the core. An initial conclusion was that these “cobalt-diffused” spinels were actually nickel diffused. Subsequent investigations using various absorption, luminescence, and fluorescence techniques along with gemological observations confirmed that the samples were indeed nickel diffused and that natural near-colorless spinel was likely used as the starting material. Additionally, nickel was confirmed to be the main chromophore responsible for the modified color. These observations are described in detail below, along with the results of some preliminary experiments on the diffused stones, discussion of heat treatment methods, and some potential identification criteria.
MATERIALS AND METHODS
Materials. Twenty-four faceted spinel samples were purchased by GIA Bangkok for scientific examination. These were all oval cut and weighed between 0.51 and 1.19 ct. Eighteen of them (thirteen nickel-diffused and five cobalt-diffused) were left in their original faceted state, but three nickel-diffused and three cobalt-diffused stones were fabricated into doubly polished wafers perpendicular to the table. The wafers were polished on both faces using a tin alloy lap impregnated with 6 μm diamond paste. Colors, weights, and forms (faceted or wafer) of the nickel-diffused stones are presented in table 1.

Analytical Methods. Gemological Testing. A total of 16 stones were studied using standard gemological methods at GIA in New York, Carlsbad, and Bangkok. The eight stones in the original parcel that were clearly cobalt diffused were not studied beyond identification of cobalt diffusion treatment. Refractive indices were measured on faceted stones and on doubly polished wafers using a GIA-built refractometer. The fluorescence reactions to both long-wave (365 nm) and short-wave (254 nm) UV light were determined using mercury lamps. Additionally, faceted stones were viewed through a Chelsea color filter and also immersed in methylene iodide in order to observe internal color variations.
Energy-Dispersive X-ray Fluorescence (EDXRF). EDXRF spectra were recorded at GIA in Carlsbad by placing faceted stones in a Thermo Quant’X EDXRF spectrometer, operating at 12 kV and 1.92 mA, with an aluminum filter. Fluorescence was recorded between 0 and 40 keV. These data are not quantified, so no detection limits are provided.
LA-ICP-MS. LA-ICP-MS data were recorded using a Thermo iCAP Q ICP-MS coupled to an Elemental Scientific 213 nm (Nd:YAG) laser ablation system via helium carrier gas. This was done using three identical LA-ICP-MS systems, at GIA in New York, Carlsbad, and Bangkok. Most stones were analyzed by ablating 35 μm circular spots on the girdles, at 20 Hz, with a ~11 J/cm2 fluence. The doubly polished wafers were ablated using the same conditions, but on one of the two main polished faces rather than on the girdle, and using a 50 μm circular spot with a centroid located at approximately 50 μm from the edge on the table side.
The analyzed elements (isotopes in parentheses) were lithium (7Li), beryllium (9Be), magnesium (25Mg), aluminum (27Al), titanium (47Ti), vanadium (51V), chromium (53Cr), manganese (55Mn), iron (57Fe), cobalt (59Co), nickel (60Ni and/or 62Ni), zinc (66Zn), and gallium (69Ga). Dwell times were between 0.01 and 0.05 s per isotope. To record a compositional transect across one doubly polished stone, the sample was moved below a stationary, continuously ablating 40 μm circular spot, with 20 Hz repetition rate and fluence around 7 J/cm2, while the ICP-MS counted continuously. Dwell times for the transect were 0.05–0.10 s per isotope, analyzing the same isotopes as listed above. Magnesium was not quantified in any analysis, but the compositional transect shows resolvable magnesium variation when calculated as magnesium/aluminum (counts per second), which can still be used to understand relative magnesium concentrations along the transect.
In all cases, background analyses were recorded for around 1 minute. The primary standard was NIST SRM 610 glass, using the reference values from Jochum et al. (2011). Data were processed using Iolite software (Paton et al., 2011), with 27Al as the internal standard, initially assuming a constant value of 39.7 wt.%. This implicitly assumes that nickel incorporation into spinel is accomplished by removal of magnesium rather than aluminum.

Detection limits were determined for each analysis using the Longerich et al. (1996) method, generally using at least 30 s of manually selected background. Minimum and maximum detection limits for all analyses, for each element, were: lithium: 0.1–0.6 ppma; beryllium: 0.1–0.5 ppma; titanium: 0.04–0.2 ppma; vanadium: 3–84 ppba; chromium: 0.06–0.36 ppma; manganese: 9–140 ppba; iron: 0.4–1.9 ppma; cobalt: 2–30 ppba; nickel: 0.05–0.4 ppma; zinc: 13–68 ppba; and gallium: 2–12 ppba. No correction was made for the decreasing aluminum content by weight associated with an increased nickel content. This is necessary for accurately determining concentrations by weight, given the difference in atomic mass between nickel and magnesium (58.69 u and 26.98 u, respectively), again assuming that nickel incorporation is associated with magnesium removal. The justification is that even at around 5 wt.% nickel, the highest measured in this study, the discrepancy between actual concentrations and calculated concentrations is <3% (figure 3). Additionally, making this correction would require a priori assumptions about valence state and coordination environment of nickel, which cannot be confidently made.
In addition to collecting LA-ICP-MS data from the nickel-diffused stones in this study, we extracted data from a larger GIA database, from analyses of blue, green, green-blue, bluish green, and greenish blue spinel determined to be natural. This yielded 1,495 individual analyses. These data were compiled for comparison with data from the diffused stones.
Energy-Dispersive Spectroscopy (EDS) Mapping. EDS spectra were recorded from sample 17407069 following gold-coating, using an Oxford X-MaxN 20 EDS detector on a Zeiss EVO Ma 10 scanning electron microscope at GIA in New York, operating at 15 keV accelerating voltage, 30 nA current, and 71× magnification. The pixel dwell time was 60 μs. Counts were extracted from spectra as the maxima on the Kα bands of oxygen, aluminum, magnesium, and nickel. Post-processing was done on the extracted X-Y-counts matrices using MATLAB. Due to the large size of the area being mapped and analytical limitations, the total count rate was not constant; therefore, all counts on aluminum, magnesium, and nickel were normalized to counts on oxygen. Additionally, a swath of data (400 × 1291 point rectangle) was extracted from the larger data matrix along a table-to-culet transect and averaged parallel to the table, to give one-dimensional transects of oxygen-normalized counts.
Ultraviolet/Visible/Near-Infrared (UV-Vis-NIR) Spectroscopy. UV-Vis-NIR spectra were recorded in absorbance mode between 200 and 1500 nm from five doubly polished wafers using a Perkin Elmer Lambda 950 UV-Vis spectrometer at GIA in New York. Four of the wafers were nickel diffused (samples 17407057, 17407124, 17407123, and 17407126), and one was cobalt diffused (17407125), with the latter analyzed for comparison only. The wafers were mounted onto an aluminum plate containing a 0.5 mm circular aperture located as close as possible to the stone’s edge. For the sample that was annealed experimentally (17407067), spectra were recorded from the whole stone using a using a custom-built UV-Vis system at GIA in Carlsbad, operating in transmission mode from 250 to 980 nm, with an integrating time of 3000 ms and 3 accumulations.
Photoluminescence (PL) Spectroscopy. PL spectra were recorded from 630 to 750 nm on the core and rim of one doubly polished wafer (sample 17407124) using a Renishaw inVia Raman microscope with a 514 nm laser, 1800 l/mm grating, and a 5× objective at GIA in New York. The power and counting times were adjusted to obtain maximum signal while avoiding saturation. The high concentration of nickel appeared to be associated with quenched fluorescence, which meant that higher power and longer accumulation times were required for spectra recorded near the high-nickel rim.
Diffusion Modeling. Diffusion is described using Fick’s first and second laws, two partial differential equations that can be thought of as defining the way in which particles spread out over space and time. In order to apply these laws to a real situation, the equations must be solved for a given set of conditions, which require approximations to be made regarding the geometry of the system (e.g., a stone) and the nature of the source of diffusing species (e.g., a high-nickel powder or melt placed into contact with the stone). The aim here is to determine Dt, which is the diffusion coefficient (D, in units of square meters per second, m2/s) multiplied by the time (t, in units of seconds, s). In this case, the diffusion coefficient is a number that describes how rapidly a given element, such as nickel, moves through spinel.
In order to determine diffusion coefficients from the LA-ICP-MS transect, concentration vs. distance data were fitted to the solution of Fick’s second law describing diffusion in a one-dimensional semi-infinite medium, using a constant boundary condition (Crank, 1975):

In this equation, x is the distance (in meters, m) from the edge, C is the concentration (in ppma) at the core (Ccore) and rim (Crim) at a given distance at a given time (C(x,t)), and erfc is the complementary error function.
This fitting was only done for half profiles, meaning the data were recorded from the core to the table, instead of table-to-culet or core-to-culet. This is because the shape of the culet renders this solution to Fick’s second law inappropriate—the solution is strictly valid only for a plane sheet with infinite extent. The flat table of a faceted stone is a reasonable approximation of this geometry, but the culet is not. The data was fitted to the model using nonlinear least squares regression implemented in MATLAB, with the output being Dt (units of m2). These Dt values are presented as their base-10 logarithm.
Experimental Methods. To complement analyses on the as-received stones, one faceted spinel (sample 17407067, bluish green) was annealed at various temperature (T) and oxygen partial pressure (pO2) conditions, and then UV-Vis spectra were recorded on the whole spinel after each step. The aim was to determine whether temperature and oxygen partial pressure could modify the defects present in the stone, and therefore potentially the color. Pure O2 at atmospheric pressure has pO2 = 1 atm. The O2 content in air is 21%, and therefore pO2 = 0.21 atm. The pO2 can also be controlled by mixing gases. In one experiment, the furnace was filled with a mixture of CO2 and H2 gases, which react to form CO, H2O, CH4, and O2, yielding a very low partial pressure of O2. A 2:1 mix of CO2:H2 was used, giving pO2 = 4 × 10⁻⁶ atm at 1750°C (Prunier and Hewitt, 1981). Experiments were conducted in a 1000-3560-FP24 Thermal Technology gas mixing furnace. The temperature/time/pO2 annealing conditions, for sequentially heating the same stone, were: (1) 1100°C for 10 hours at 1 atm, (2) 1700°C for 18 hours at 1 atm, and (3) 1750°C for 40 hours at 4 × 10⁻⁶ atm.
RESULTS
Gemological Observations. Gemological observations were consistent with spinel. Refractive indices for the nickel-diffused samples were generally 1.718, but some samples had values as high as 1.725, possibly due to the increased concentration of nickel at the surface. All samples were inert to long-wave UV light. Most were also inert to short-wave UV, but a few showed faint chalky yellow fluorescence near the edges when prepared as doubly polished wafers. All faceted stones had a weak to strong red reaction when viewed through the Chelsea color filter. The doubly polished wafers viewed in this way showed color zonation: red at the rim and colorless in the center.

When immersed in methylene iodide, the faceted stones displayed a strong concentration of color around the rim of the stone (figure 4A), sometimes with additional subtle color concentration along the facet junctions (figure 4B). Microscopic observations sometimes revealed this same color concentration along facet junctions, particularly at the keel of the stones, although the effect was more subtle here than in other treated material, such as titanium-diffused sapphire. The most striking microscopic feature was the abundance of artificially healed fractures, likely associated with the presence of a flux material during heating (figure 4, C–F). This is also supported by the trace element data, described below, which show high amounts of lithium at the stones’ edge—lithium is a common component of flux material.

Compositional Analysis. X-ray Fluorescence. EDXRF spectra of nickel-diffused stones (e.g., figure 5) consistently showed the strongest bands at 7.47 keV, interpreted as the sum of the nickel Kα lines (Kα1 and Kα2 at 7.48 and 7.46 keV, respectively), with an associated Kß band at 8.26 keV. No nickel L lines are visible in figure 5. Also clearly visible are Mg Kα (1.25), Al Kα (1.48), Fe Kα (6.40), Fe Kß (7.06), and Zn Kα (8.64). No Co Kα line is visible at 6.93 keV.


LA-ICP-MS. Single Point Analyses. Table 2 shows the concentrations of measured trace elements, measured either on the girdle of as-received faceted stones or at around 50 μm from the table in doubly polished wafers. The concentration of nickel at the edge of the spinel was high, around 10000–20000 ppma. These nickel concentrations are very high compared to natural gem-quality spinel submitted for analyses at GIA (figure 6A). It should be noted, however, that the nickel end member of the spinel group (chihmingite, NiAl2O4) does exist in nature (Miyawaki et al., 2022).

Along with elevated nickel, some but not all stones also contained high lithium concentrations, up to around 3000 ppma at the surface (see table 1). Such high lithium is rare in natural, untreated gem spinel (figure 6B). Concentrations of other elements, even if added or removed during the diffusion treatment, were generally within normal ranges for gem spinel. Notably, this also includes beryllium (figure 6C), despite the increasing concentration of beryllium toward the edge in the LA-ICP-MS transect, described below (figure 7).
Additionally, the concentrations of all other measured elements (titanium, vanadium, chromium, manganese, iron, cobalt, zinc, and gallium) were highly variable between stones. Preliminary analyses from the cores of other doubly polished wafers (samples 17407047, 17407126, 17407123, and 17407069) showed different concentrations of elements other than nickel (see table 2) in areas apparently unaffected by diffusion, suggesting that these concentration variations relate at least partially to different starting materials (i.e., different natural spinel ) rather than different treatment conditions. At this point, however, we cannot confidently describe the nature of the starting materials.
These data show that nickel appears to be a weak chromophore, as thousands to tens of thousands of ppma led to relatively weak colors. In contrast, cobalt diffusion treatment requires only a few hundred to thousands of ppma cobalt to create deep blue colors (e.g., Saeseaw et al., 2015; Krzemnicki et al., 2017). This may relate to the incorporation mechanism of nickel, described below (in the “Nickel Incorporation Mechanism and Valence State” section).
Concentrations Recorded Along a Transect. In one stone where trace element concentrations were recorded along a central transect (sample 17407124), nickel, lithium, beryllium, zinc, manganese, and cobalt show decreasing concentrations from the rim to the core (figure 7), with U-shaped profiles. The largest concentration change is associated with nickel, from ~1 ppma in the core to ~5000 ppma at the rim. Cobalt shows the smallest change, from ~0.4 ppma at the core to ~0.8 ppma at the rim. Conversely, vanadium, iron, and magnesium display inverted U-shaped profiles—i.e., lower concentrations at the rim than at the core. The magnesium profile is displayed separately, as this cannot be accurately quantified when using NIST SRM 610 as a primary standard and aluminum as the internal standard. The likely reason is that the magnesium concentration in the NIST SRM 610 standard glass is around three orders of magnitude lower than in the spinel. As a result, using the analytical and data reduction routine described above, the quantified magnesium content is about 30% lower than expected. This is not problematic for estimating diffusion coefficients, though. Chromium and titanium show variable concentrations, but neither has a clear U-shaped or inverted U-shaped profile. Gallium shows no apparent concentration change.

EDS. EDS has considerably higher spatial resolution than LA-ICP-MS but suffers from much poorer detection limits, so the only elements that could be measured were nickel, magnesium, aluminum, and oxygen (figure 8). Nickel shows a clear concentration decrease from rim to core. Magnesium shows the opposite, which is discussed later, and aluminum shows no apparent zonation. The zonation pattern of nickel conforms to the faceted stone’s shape.

UV-Vis-NIR Spectroscopy. UV-Vis-NIR spectra recorded from the rims of double-polished wafers recovered from as-received stones show main peaks at 369, 381, 475, 597, and 639 nm (figure 9). These positions are consistent with those present in spectra recorded from nickel aluminate powders synthesized for use as cyan dyes (Serment et al., 2020), nickel-doped single-crystal spinel (Jouini et al., 2007), and nickel-doped gahnite (ZnAl2O4; Lorenzi et al., 2006). Figure 9 also shows a spectrum recorded from a cobalt-diffused spinel, obtained in the same parcel as these nickel-diffused crystals, showing clearly different absorption band positions.

Following the experimental anneal at 1100°C in pure O2 (10 hours), the 475 nm band increased in intensity relative to the as-received stone (figure 10). There was no clear change in the intensity of the 369, 381, 597, and 639 nm bands. There was no apparent change in the spectra following a subsequent higher-temperature anneal in pure O2 at 1700°C (18 hours). Following the 1750°C anneal in a low-pO2 2:1 CO2-H2 mix (40 hours), however, the 475 nm band was completely eliminated and the intensity of the 369, 381, 597, and 639 nm bands decreased considerably, as did the overall absorbance. This is consistent with the final color, which was a much lighter blue than the original stone.

PL Spectroscopy. PL spectra recorded with 514 nm excitation are shown in figure 11. Spectra of the nickel-diffused stones are similar to those of heat-treated natural spinel (Widmer et al., 2015), which is in line with visual observations of inclusions and refractive indices. As with most natural spinel, the spectra are dominated by bands attributed to chromium. The spectra show broadening of the band(s) at around 686 nm.
PL spectra recorded near the spinel rims are different from those recorded in the cores, with the rim spectra showing a dominant band at 687.5 nm and core spectra showing a strong doublet with maxima at 685.6 and 687.3 nm. This difference in PL spectra may be associated with nickel, but it is notable that a spectrum recorded from a natural, unheated spinel with relatively high nickel (around 350 ppma) from GIA’s production database did not clearly display this feature. Spectra recorded from faceted stones using nonconfocal PL spectroscopy will likely show some combination of these spectra.
DISCUSSION
Nickel Incorporation Mechanism and Valence State. First, there are two likely valence states of nickel ions in spinel: Ni2+ and Ni3+. The superscripts refer to the charges of the cation where Ni2+ has lost two electrons, and Ni3+ has lost three, relative to nickel in its normal metallic state with zero charge. Because the loss of electrons is oxidation, the expected result is that, all other things being equal, a spinel treated with nickel in an oxidizing environment (generally an atmosphere having a high oxygen concentration, such as air), will have a relatively high ratio of Ni3+ to total nickel. Conversely, a spinel treated in a reducing (generally low-oxygen) atmosphere will have a relatively high ratio of Ni2+ to total nickel.
With two valence states, there are also two locations for nickel incorporation in spinel, either on the tetrahedral or octahedral site. The terms “tetrahedral” and “octahedral” refer to the location of these cations in the crystal structure with respect to the O2– anions (ions with a negative charge). A cation in a tetrahedral site in spinel is bonded to four O2– anions, forming the shape of a tetrahedron with the cation in the center. In octahedral coordination, the cation is bonded to six O2– anions, which form an octahedron. These octahedra and tetrahedra stack together to form the atomic structure of spinel. Overall, then, there are four main possibilities for nickel incorporation, with two valence states (Ni2+ and Ni3+) and two sites (octahedral and tetrahedral).
In natural spinel (MgAl2O4), which is likely to be the starting material for the diffusion treatment, Mg2+ mainly occupies the tetrahedral site, and Al3+ mostly occupies the octahedral site (O’Neill and Navrotsky, 1983; Widmer et al., 2015). This can be described as a low “degree of inversion.” Chihmingite, NiAl2O4, is more complex because it tends toward an “inverse” spinel structure (having a high degree of inversion), meaning the octahedral sites are considerably occupied by Ni2+, and Al3+ tends towards tetrahedral sites (Datta and Roy, 1967; Porta et al., 1974; O’Neill et al., 1991). This potentially means that a nickel-diffused spinel will show a degree of inversion that is intermediate between MgAl2O4 and NiAl2O4.
While we do not have sufficient information to fully assign valence states and sites to the nickel in these diffused spinel, we can make some speculations based on the data collected. First, from the LA-ICP-MS traverse and EDS maps, the decrease in nickel concentration from the rim to the core of the stones, coupled with magnesium showing the opposite trend, suggests nickel primarily replacing magnesium—i.e., Ni2+ and/or Ni3+ replacing Mg2+.
Second, the main visible absorption bands in the spectra of the nickel-diffused spinel, at 597 and 639 nm, were assigned by, for example, Porta et al. (1974) and Serment et al. (2020), to nickel in tetrahedral coordination. The generally smaller bands at 369 and 381 nm were associated with nickel in octahedral coordination. The similarity between the absorption spectra of the nickel-diffused spinel and a spectrum of single-crystal nickel-doped spinel grown in a relatively low (but undefined) pO2 argon atmosphere (figure 9; see also Jouini et al., 2007) suggests that the nickel is predominantly in its reduced form Ni2+.
Third, the experimental results are useful for interpreting the 475 nm band, assigned by Sakurai et al. (1969) to nickel in tetrahedral coordination. This grew during a low-temperature (1100°C) anneal in pure O2, suggesting that it relates to Ni3+. During longer and higher-temperature anneals in pure O2, the band did not increase further. When annealed at very low pO2, the 475 nm band was completely eliminated, which would be consistent with Ni3+ being reduced to Ni2+. Therefore, we can assign this band to Ni3+ with some confidence. As the 475 nm band absorbs in the visible range, this suggests that the color of a nickel-diffused spinel can be fine-tuned after treatment by a second oxidation or reduction treatment. Oxidation leads to more greenish hues, while reduction removes the green and shifts the color into a more exclusively blue hue.
Overall, the data suggest that the main nickel incorporation mechanism responsible for the spinel’s color is Ni2+ replacing Mg2+ in tetrahedral coordination, shown by the 597 and 639 nm bands. The 475 nm band may be related to Ni3+ in tetrahedral coordination. However, this does not mean that all nickel is in tetrahedral coordination; in fact, it might only be a small fraction of the Ni2+ (e.g., Porta et al., 1974), although we cannot directly address this with our data.
This could explain the observation that nickel is apparently a weak chromophore in spinel. It is possible, however, that the main chromophore is Ni2+ in tetrahedral coordination, with a minor contribution of Ni3+, but the majority of the nickel is Ni2+ in octahedral coordination.


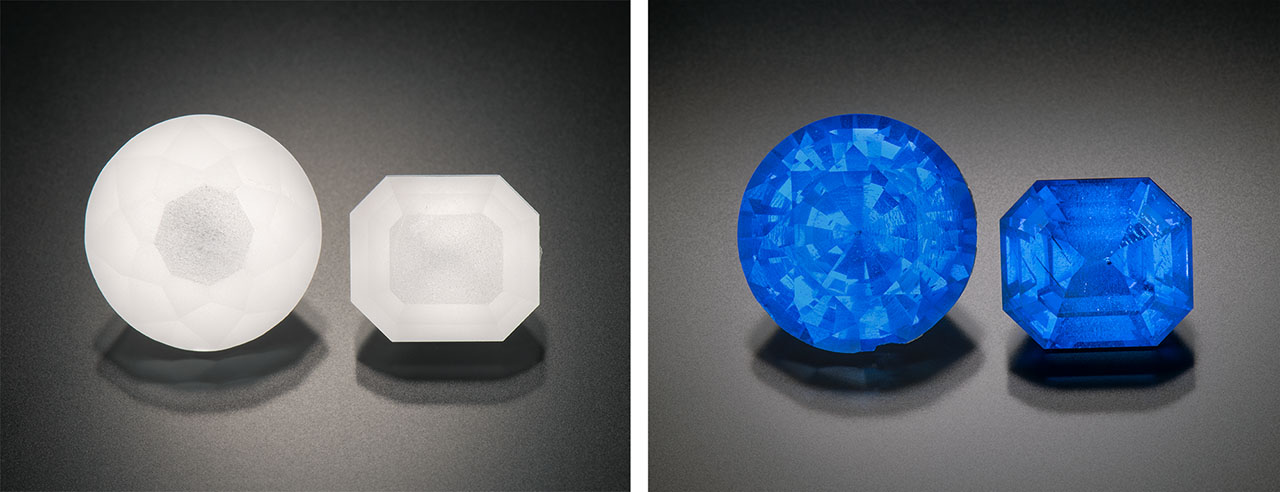
Diffusivities. Fits of the compositional profiles for nickel, lithium, iron, zinc, vanadium, beryllium, cobalt, and magnesium to equation 1 (from the “Diffusion Modeling” section) are presented in figure 12, along with values of Dt (with units of m2). These Dt values are also presented in figure 13. They increase in the following order: V Because the durations (t) of the heat treatment of the stones studied are not known, it is not possible to precisely or accurately obtain D from Dt. Likewise, because the temperatures of the treatment are also not known to us, and because experimental datasets describing diffusion coefficients are extremely limited in any case, neither can t be determined using a known D. It is tempting to use the zonation in iron and magnesium to extract duration using iron and magnesium diffusion coefficients that have been determined experimentally (Sheng et al., 1992; Liermann and Ganguly, 2002), but the different measured D values for iron and magnesium lead to a 3–4 orders of magnitude discrepancy at temperatures over 1500°C, notwithstanding the usual potential inaccuracies associated with data extrapolation. However, we can reasonably make two broad assumptions about the nature of the heat treatment. The first is that it is likely conducted at 1500–1700°C, the upper limit being both a safe temperature to avoid partial melting in a spinel with considerable concentrations of impurities (i.e., nickel) and the normal upper limit for continuous operation of standard high-temperature muffle furnaces with molybdenum disilicide elements. The lower limit is conservative—based on previously published data (e.g., Sheng et al., 1992), it is unlikely that diffusion can lead to hundreds of micrometers of diffusive penetration into the stone. Given the economics of treatment, we assume a short duration (again, extremely conservative) of one hour to one week. With these very broad constraints, a range of D values for nickel can be estimated from Dt using t = 3600 s (1 hour) and 6 × 10⁵ s (1 week). These can then be placed onto an Arrhenius diagram, which describes D (as its base-10 logarithm log10D, in m2/s) as a function of temperature (as inverse temperature in Kelvins, 1/T). This is shown in figure 13, along with some other experimentally determined diffusion coefficients for divalent cations in spinel as well as hydrogen for comparison. Also shown is the diffusion coefficient estimated for beryllium in corundum by Emmett et al. (2003), which is pertinent for general considerations of heat treatment of gemstones. While these values are imprecise, they should provide a useful starting point for future experimental efforts. The shapes of nickel diffusion profiles—i.e., the forms of concentration vs. distance data in figure 7—correspond almost perfectly to equation 1. This means that there is a smooth decrease in nickel concentration, and associated color, from the edge of a spinel to the core. This implies that diffusion in this system is relatively simple, with little or no trapping behavior—such non-simple behavior could be expressed as sharp color changes, as is often observed in titanium-diffused sapphires, for example. The likely diffusion mechanism would then involve a simple exchange of vacancies with Ni2+, which has been proposed as one mechanism of Cr3+ diffusion in spinel (Posner et al., 2016). Zonation Patterns. The zonation patterns extracted from the EDS map, shown in figure 8, can be used to provide some information regarding the heat treatment method. In the maps, we can see that the zonation patterns are broadly parallel to the edges of the stone, excluding the noise in the data. In other words, if contours were drawn defining regions of equal nickel concentration, they would generally have the same shape as the stone. In a mineral with cubic symmetry (such as spinel), diffusion treatment will lead to concentration contours that are smooth but generally parallel to the edges of the stone, regardless of the stone’s geometry. An example is shown in figure 14, where diffusion has been modeled in a simplified two-dimensional system for both a faceted shape and an example “rough” shape. If faceting is done before the diffusion treatment, then the contours of equal concentration will essentially match the shape of the faceted stone. This is what is seen in the nickel-diffused spinel, as in figure 8. However, if the diffusion treatment is done on a rough stone that is subsequently faceted, the contours will likely be intersected by the newly cut surface. In the example in figure 14, this would lead to a patchy appearance, with the degree of patchiness dependent on the relative geometries of the rough and faceted stones. What cannot be accurately determined using our data, though, is whether the faceting done before the diffusion treatment was complete or partial. The diffusion treatment could have been done on a partially faceted, unpolished stone, with final faceting and polishing after the treatment. To demonstrate this process, two flame-fusion synthetic spinels were diffused with nickel at 1800°C in a furnace at GIA in Carlsbad, California. The two stones were completely colorless beforehand and facet patterns were roughly ground in. Diffusing these stones with nickel at 1800°C created a rich blue color as seen in the polished gems in figure 15. It is also notable that local color concentrations were visible at facet junctions, which is consistent with diffusion treatment conducted after faceting. Speculations Regarding the Heat Treatment Method. The most salient lines of evidence in determining the heat treatment method are: Overall, the evidence suggests the treatment of natural faceted or partially faceted spinel in the presence of a high-nickel melt, where some lithium compound is used to enable flux melting. This is often advantageous because any adhered melt can be readily dissolved off the stone after treatment. As described above, the treatment is likely at high temperature (>1500°C), given the depth of the diffusion profiles as well as considerations of the economics of heat treatment. The presence of the 475 nm band suggests that the treatment was done in an oxidizing atmosphere, which could simply be air, because this band is eliminated if annealed in a reducing gas mix. Finally, there is a possibility that the use of nickel rather than cobalt as a diffusant was accidental, or alternatively that the term “cobalt-diffused” is now used by some treaters as a generic term for diffusion treatment in spinel. Blue or green hues can be added to spinel by nickel diffusion. Spinel modified using this treatment method now exists in the gem trade. The possibility for color modification by nickel diffusion should be considered for any spinel with such colors. The following criteria are proposed for identifying nickel diffusion treatment in spinel: Overall, the treatment should be readily identifiable using standard gemological techniques and equipment.
CONCLUSIONS